How to read an earnings report, part one

If you want to become an investing pro, at some point you’re going to have to read an earnings report. These reports usually come out four times a year and are absolutely packed with information and numbers. On first sight, they can be a bit intimidating. But they’re not as scary as they look, and with some help from us, you’ll be analyzing them in no time.
In this post, we’re going to go through this earnings report by Apple, which was released on January 27, 2021. The report goes through all the money the company made and spent in the three months up to December 26, 2020. There’s already a few differences here to note: from a calendar perspective, the quarter would be called the fourth quarter, and go until December 31. For Apple, it’s the first quarter, and it ends five days earlier. This is because companies can decide when their quarters start and end. That’s why it’s important to check whether a company’s quarter is the same as a calendar quarter.
The basics
Though each company’s earnings report looks slightly different, it contains a few standard portions: a statement of operations, a balance sheet and statement of cash flows. The statement of operations is about how the company’s business went in the quarter: how much of its products it sold, how much money it made off those sales, and so on. The balance sheet is an accounting document that tracks how much money a company has, how much it owes, and balances those two with a third metric called equity. We’ll get into that in a later blog post. Today, we’re going to focus on the statement of operations.
Going from sales to profit
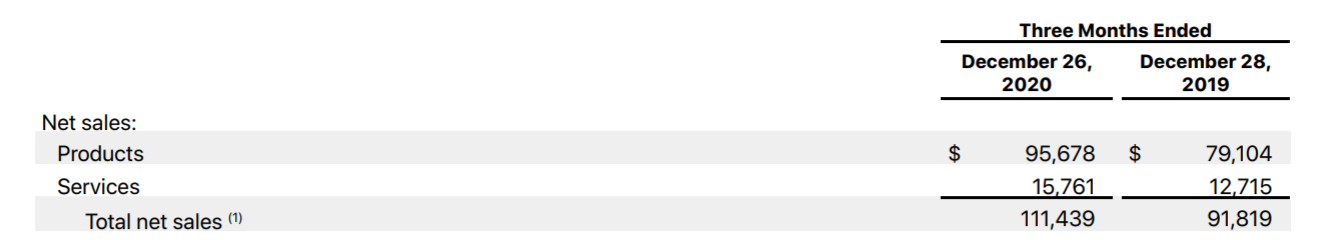
If you look at the Apple document, you can see it has a lot of lines with numbers on the right side. These are all the sales and expenses of the company in the quarter. The first number is the latest quarter, and the one to the right of it is from the year before, meant to give investors a quick look at whether numbers went up or down when compared to last year.
Let’s focus on a few important lines here.
The first two lines, products and services, show much much money Apple made from selling physical things like iPhones and Macs, and how much it made from services like iCloud, Apple Music and so on. As you can see, both sales were up that quarter when compared to the previous year.
Next comes the cost of sales and expenses. First, the total cost of sales, which is the money Apple had to spend to make the iPhones, computers and software it sells directly. This includes labour costs, raw material costs, and a bunch of other things. Once you subtract that from the total net sales, you get a gross margin — roughly how much profit the company made from its sales. Some companies will give you a percentage value here. Apple doesn’t.
But there are other expenses — running a company means having research, HR, and a bunch of other departments that aren’t directly related to making a product sold. These are all collected into operating expenses. Once you subtract those from the gross margin, you get operating income — a profit measure that more accurately shows how much money a company made after you subtract costs.

As you can see, it doesn’t quite end there. There are a few more expenses to deduct — taxes being the most important here. Once you deduct that, you get net income — a rough measure of how much profit the company made once all other expenses are deducted.
Earnings per share
Now it’s time to divide that into earnings per share. By taking the net income, and calculating how much income was made per share, you get a nice low number that shareholders can understand and is directly attributable to them. In this case, every share of Apple made about $1.70 per share. This is the basic earnings per share. There’s also a diluted version, which takes into account things like convertible bonds — instruments that can be turned into Apple shares at a later date.
Net sales by segment and category
Companies will often also divide their sales into categories. Sometimes these are company divisions, sometimes geographical markets. Often, it’s both. In the Apple earnings report, after net sales, you can see its sales broken down by rough geographic markets, and then into broad categories: iPhone, Mac, iPad, Wearables Home and Accessories, and Services. How this is divided up is completely up to Apple. Notice how they lump a few things like the Apple Watch, Apple TV and Homepod into one category, which means investors don’t quite know how many Apple Watches were sold that quarter. Sometimes executives will give more insight into this number on an earnings call - a phone conference with press and analysts where executives answer questions on the earnings report.
And with that, we’ve gone through a complete statement of operations together. It might feel like a lot, but the more you look at them, and recognize the broad categories they are divided into, the easier it becomes to read these reports.
Take the time to read a few reports by different companies, and don’t get discouraged if it doesn’t make sense at first. You don’t have to become a pro overnight. Pay attention to every small step forward you make — the first time you recognize a net sales, or a profit line, and celebrate that victory. With time and patience, the improvements will keep coming.
Want to know more? Read the second part of our earnings report guide here.